U.S. Infrastructure is falling behind its competitors: Over the last few years, global infrastructure rankings have identified that the U.S. infrastructure is dangerously falling behind that of its global peers and competitors (e.g., China 1 ). The U.S. currently ranks 13th in the World, behind Japan, 2 Korea, Germany, and France, as shown in the figure below.
Figure 1 : Quality of Overall Infrastructure
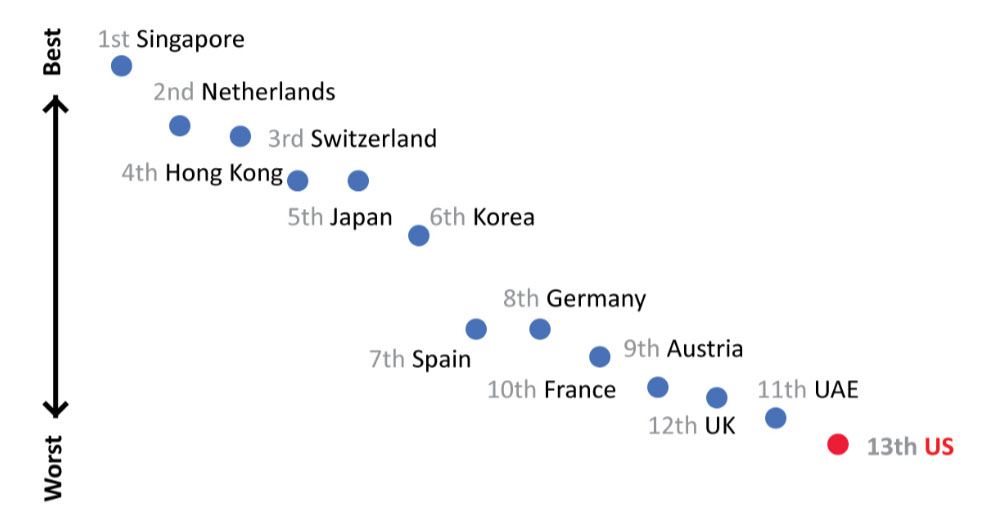
Source: World Economic Forum, The Global Competitiveness Report 2019, October 2019.
Art: Weaver Advisory design
Note: The World Economic Forum score on overall infrastructure includes transport, utility, and water. Only the top 13 ranked countries are shown.
Infrastructure is key for economic growth: Experts 3 believe that the reason behind U.S. sustainably strong economic growth post World War II was infrastructure investment. They also believe the opposite is true: The recent streak of small investments in infrastructure has stalled the rise in U.S. productivity and GDP in recent years.
The cost of inaction: The country’s investment in transportation infrastructure is currently at 1.6% of its GDP, down from 2.2% in the 1960s. If the U.S. had maintained the latter investment level, GDP would be US $1 trillion above current levels. Urban congestion alone costs US $160 billion per year. 4
Airport delays and avoided trip costs amount to US $35 billion. 5 Waterways and Port delays plus congestion added another US $33 billion in cost for the U.S. economy. U.S. Rail infrastructure quality is very low—only 25% is rated good or excellent. 6 As one can see from the chart, these figures are expected to grow in the future, if we continue at the current pace of investment growth.
Figure 2: U.S. Infrastructure Investment Gap by 2040
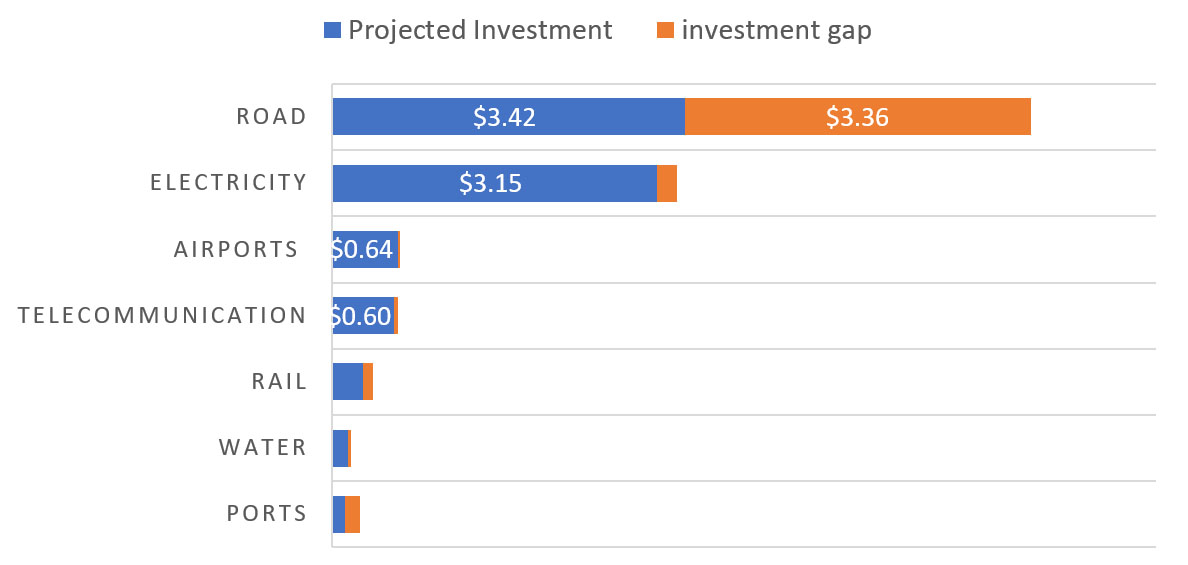
Source: Global Infrastructure Hub
Notes: Investment Gap is the difference between projected investment and the investment required to match the best performing peer countries, accounting for differences in country characteristics. Projected Investment assumes that the U.S. will continue to invest at current levels and accounts for economic and population growth.
We need to fix this infra spending gap: As one can see on the figure above, according to the Global Infrastructure Hub, 7 Oxford Economics Data, and forecasts up to 2040, the projected U.S. investment for the sector in Roads is US $3.42 trillion, and an additional US $3.36 trillion would be needed to match the best performing peer country in the sector.
As the U.S. is the leading world economy, one would assume the optimal choice would be for that lead to continue, if the country is able to keep up with the highest global standards in infrastructure. Electricity, Airports, Telecom, and Water have much smaller expected gaps. However, Rail and Ports have sizable gaps, albeit on a much smaller scale than Roads. Hence, there is clearly a gap in investment that needs to be fixed, and it is above US $3.5 trillion.
The relationship between infrastructure and productivity
Infrastructure investment fuels total factor productivity: The GDP formula relies on three basic accounts to estimate the total economic output of a country: labor, capital, and total factor productivity (TFP). Total factor productivity is a residual value that explains how one economy can grow faster than another with equal amounts of labor and capital.
It has two basic elements: one is education, the other infrastructure. Education gains are usually seen more on the long-term. Infrastructure investment contributes to more agile gains in productivity. Hence, for a country to grow its GDP, cetera paribus, it must grow its productivity. There are no shortcuts. The U.S. tried to inject large amounts of funds into the economy, but the TFP continued its inexorable decline (considering the current weak infrastructure spending), as one can see on the chart below.
Figure 3: Fed Asset Purchase Program Vs. TFP baseline growth trajectory (1998-2019)
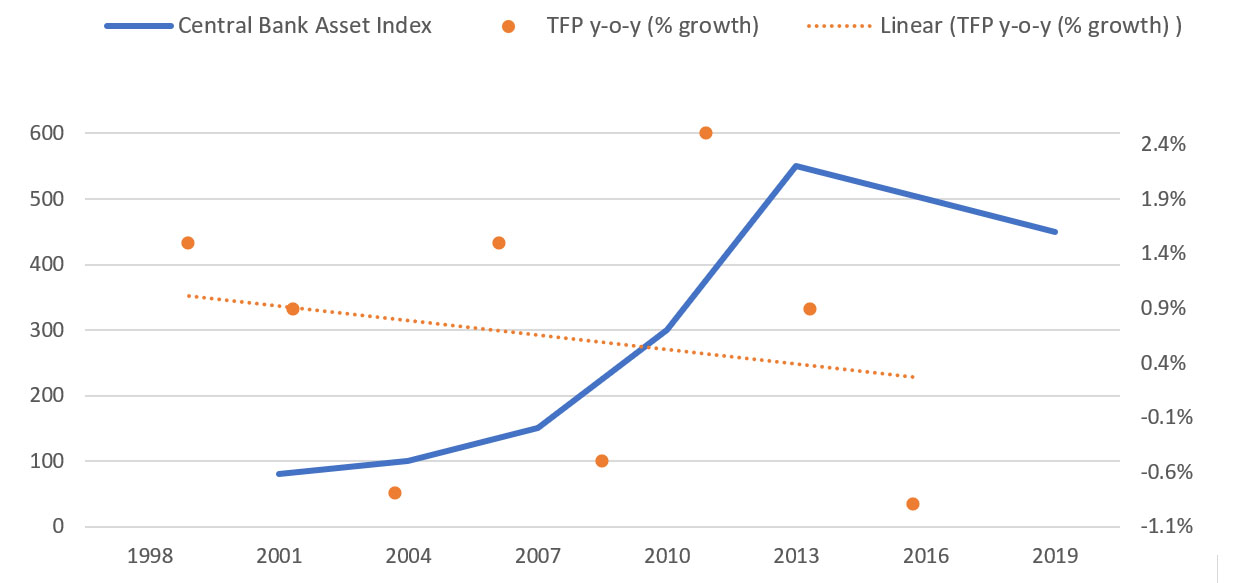
Source: Global Infrastructure Outlook
Infrastructure to boost productivity: As one can see on the chart above, the Fed has grown its asset base from US $100 billion to US $500 billion from 2007 to 2012, literally stacking an additional US $100 billion every year for five years. Meanwhile, productivity growth continued its trajectory that started back in 1998 and tilted downward to below 1% per annum. Since productivity has not been reacting to larger injections of capital into the economy, as expected, the U.S. must grow its investment in infrastructure.
Infrastructure to reduce income inequality: Mind you, this does not enter the debate of infrastructure as a way to reduce income inequality, or to reduce poverty. Income inequality is a growing problem in the U.S., as one can see in the graph 8 below.
Figure 4: Income Share of the Top 10% earners
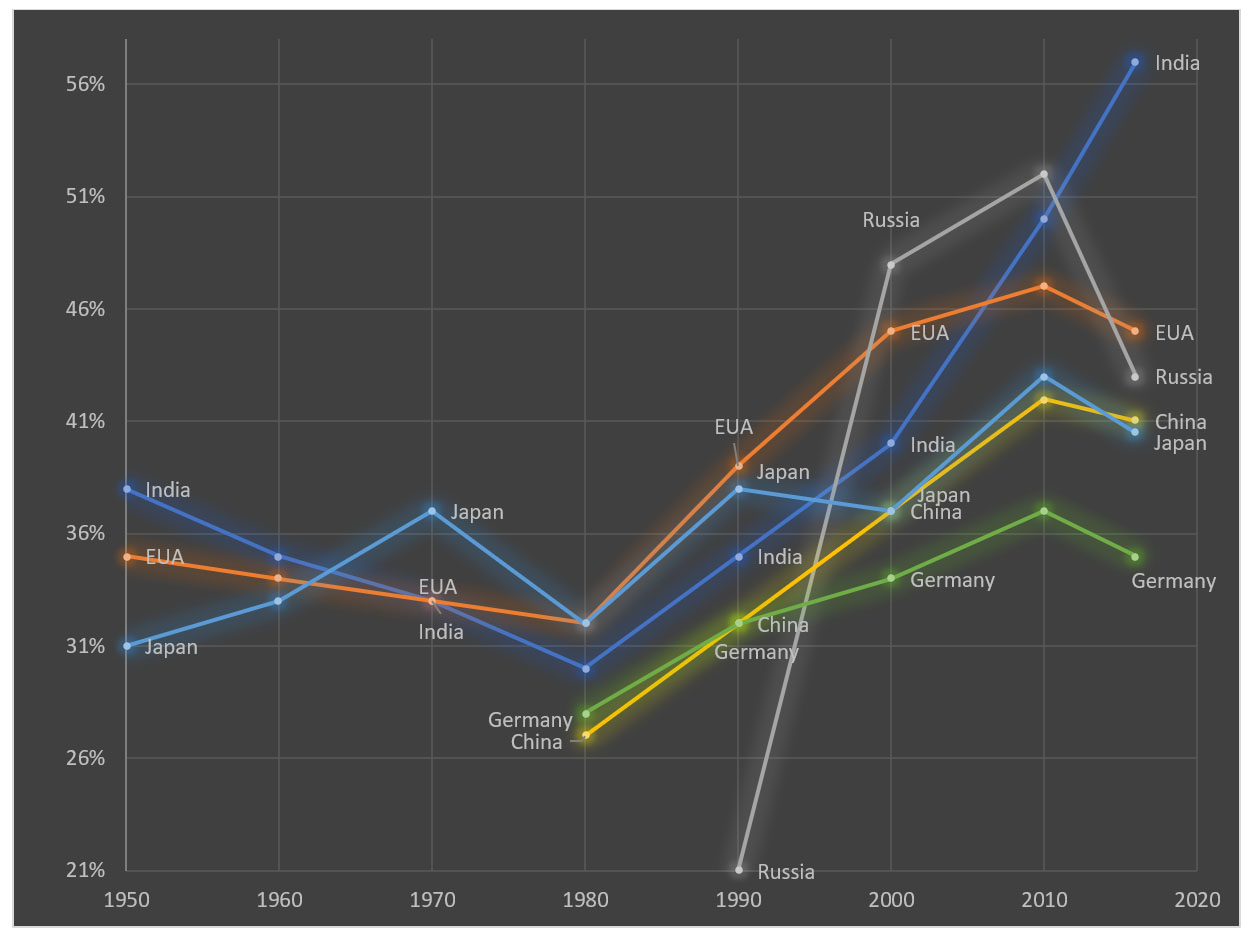
Source: World Inequality Lab, World Inequality Database
Notes: Share of pre-tax national income of the 90-100 percentile of adult individuals. Pre-tax national income is the sum of all pre-tax personal income flows accruing to the owners of the production factors.
U.S. inequality continues to rise: As one can see on the figure above, U.S. income inequality (in orange) is now higher than that of comparable countries, Germany (in green) and Japan (in light blue) and rivals—China (in yellow). It is now comparable to developing countries: worse than Russia, but still better than India. 9 The U.S. must also address this issue as growing income inequality brings problems in terms of social unrest. 10 It also reduces potential total economic output. 11
Infrastructure to tackle income inequality: Theory says that investment in infrastructure is neutral from a social justice perspective. Social investment on the other hand is directly focused on reducing poverty. But for many reasons, such as the exclusionary nature of poverty itself, which makes it difficult for low-income families to capture social benefits directed to them, 12 social spending is hardly effective in reducing poverty.
Thus, infrastructure investment, in its potential vastness compared to social spending, has also an important level playing field impact for low-income families. 13 If not reducing income inequality, reducing the speed of its inexorable growth pace, as seen in the past decades in the U.S.
In conclusion, we must invest in infrastructure to grow, and it might incidentally help the poor. This can be especially important in the aftermath of the COVID pandemic, which disproportionately affected the poor who were unable to work online and were more prone to be affected by the disease.
A University of Maryland study from 2014 shows that for every US $1 invested in infrastructure, the U.S. GDP would grow US $3. 14 That ratio would be even larger in times of recession. Thus, infrastructure spending is a way to move the country out of a crisis and to generate jobs. Much like FDR’s New Deal helped the U.S. out of the depression in the 1930s and Biden can do now on the aftermath of COVID pandemic. But at what cost? We will see in the next article “Funding Biden’s Infrastructure Plan.”
 Bernardo Weaver is the CEO of Weaver Advisory, producing Macro Research, Financial Modeling, and transaction advice to global financial institutions. Mr. Weaver has over 17 years of experience advising the World Bank on international deals. He is a financial modeling instructor to top investment banks and hedge funds in Wall Street and London. He also teaches M&A as an adjunct professor at Georgetown University’s McDonough School of Business. Mr. Weaver holds a Wharton MBA degree and has been based in Washington D.C. for the past 20 years, living in Georgetown with his wife and two kids.
**Disclaimer**
This article was prepared exclusively for Blaylock Van, LLC. Links are solely intended for convenience and are not intended to be advertisement whatsoever. Linked sites are not under the control of Blaylock Van, LLC and Blaylock Van, LLC is not responsible for the content of any linked site or any link contained in this article. Blaylock Van, LLC does not endorse companies, or their products or services, to which it links. If you decide to access any of the third-party sites linked to this site or article, you do this entirely at your own risk. This document is confidential and has been prepared for informational purposes only. This document is not to be construed as a recommendation, an offer to sell or a solicitation of an offer to buy any securities. Any dissemination, distribution or reproduction of this document is strictly prohibited without the consent of Blaylock Van, LLC. The information herein is obtained from sources deemed reliable, but its accuracy and completeness cannot be guaranteed, and is subject to change without notice.
Bibliography
[1] The United States Government. (2021, May 4). FACT SHEET: The American Jobs Plan. The White House.
https://www.whitehouse.gov/briefing-room/statements-releases/2021/03/31/fact-sheet-the-american-jobs-plan/
[2] Roundtable, B. (2015, September 16). Road to Growth: The Case for Investing in America’s Transportation
Infrastructure.
[3] Council on Foreign Relations. (n.d.). The State of U.S. Infrastructure. Council on Foreign Relations.
https://www.cfr.org/backgrounder/state-us-infrastructure
[4] See footnote 1
[5] See footnote 3
[6] See footnote 2
[7] Global Infrastructure Outlook – July 2017.pdf, available at https://outlook.gihub.org/
[8] Schwab, K. (Ed.). (2019). The Global Competitiveness Report 2019. World Economic Forum.
http://www3.weforum.org/docs/WEF_TheGlobalCompetitivenessReport2019.pdf
[9] See footnote 8
[10] https://blogs.imf.org/2020/12/11/when-inequality-is-high-pandemics-can-fuel-social-unrest/
[11] https://www.oecd.org/newsroom/inequality-hurts-economic-growth.htm
[12] https://www.washingtonpost.com/business/economy/13-million-people-in-poverty-are-disconnected-from-the-
social-safety-net-most-of-them-are-white/2019/02/04/807516a0-2598-11e9-81fd-b7b05d5bed90_story.html
[13] https://www.ilo.org/global/docs/WCMS_099513/lang–en/index.htm
[14] https://www.cfr.org/backgrounder/state-us-infrastructure